Thursday, December 30, 2010
Application of Differentiation
APPLICATION OF DERIVATIVES
A rectangular sheet of tin 7cm x 5cm is to be made into a box without top, by cutting off squares from the corners and folding up the flaps. What should be the side of the square to be cut off so that the volume of the box is maximum ?
Applet
Monday, November 29, 2010
Integration
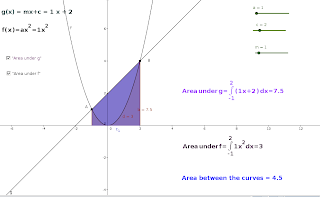
Area between Two Curves - Integration
Applet
Steps for constructing the applet
1.Open a new geogebra file
2.Create 3 sliders on number and give names a, c and m ( min: 0, Max : 10, Incr: 0.1 )
3.Create the function f ( f(x) = ax2 by typing in the Input field f(x) = a*x^2
4.Create the function g ( g(x) = mx + c by typing in the Input field g(x) = m*x + c
5.Mark the intersecting points A and B between the curve and the line using the tool Intersect Two objects
6.Create the number b which is the area between the curve g(x) and the x- axis by typing in the Input field Integral[g(x), x(A), x(B)]
7.Create the number d which is the area between the curve f(x) and the x- axis by typing in the Input field Integral[f(x), x(A), x(B)]
8.Use the tool Insert Text and and type the following text “g(x) = mx+c = ” + m + “x + c
9.Create the Checkbox e and give it the caption “Area under g ”. From the drop down menu add “Number b : Integral of g from x(A) to x(B)”
10.Use the tool Insert Text and and type the following text "f(x) =ax^2 = " + a + " x ^2"
11.Create the Checkbox h and give it the caption “Area under f ”. From the drop down menu add “Number d : Integral of f from x(A) to x(B)”
12.Use the tool Insert Text and and type the following text "Area \,under \, g = \int_{" + (x(A)) + "}^{" + (x(B)) + "}(" + m + "x +" + c + ")\,dx = " + b
13.Use the tool Insert Text and and type the following text "Area \, under \, f = \int_{" + (x(A)) + "} ^ {" + (x(B)) + "} " + a + "x^2dx =" + d
14.Use the tool Insert Text and and type the following text "Area between the curves = " + (b - d)
Wednesday, November 3, 2010
Derivative of functions using Geogebra
Derivative and Tangent of Sin(x)
Click here for the applet
1. Insert the function f(x) = sin(x) into the input field and press enter key.
2. Create a poin A on f.
3. Use the tool Tangents and click on the point A and on the function f. Change the tangents name to t
4. Type the command s = Slope[t] into the input field and press enter key. Use the move tool to drag the point A with the mouse and observe the movement of the tangent.
5. Type B = (x(A), s) into the input field and press enter key.
6. Right click on the new point B and give tick mark (switch on ) on Trace on button.
7. Use the move tool and drag A with the mouse. Then B will leavea trace.
8. Type the command Derivative[f] into the input field.
9. Use the move tool and drag A with the mouse and observe the movement.
10. Save the construction.
Monday, October 4, 2010
Trigonometric Functions
Applets
The word Trigonometry is derived from the greek words , 'Trigon' and 'Metron' and it means 'Measuring the sides of a triangle'. The subject was originally developed to solve geometric problems involving triangles. It was studied by sea captians for navigation, surveyor to map out the new lands, by engineers and others. Currently Trigonometry isused in many areas such as the Science of seismology , designing electric circuits, describing the state atom, predicting the heights of tides in the ocean, analysing a musical tone and in many other areas.
.
Angle
Angle is a measure of rotation of a given ray about its initial point. The original ray is called the initial side and the final position of the ray after rotation is called the terminal side of the angle. The point of rotation is called the vertex. If the direction of rotation is anticlockwise, the angle is positive and if the direction of rotation is clckwise, the angle is negative.
If a rotation from the initial side to terminal side is (1/360)th of a revolution, the angle is said to have a measure of one degree written as 1o. A degree is divided into 60 minutes, and a minute is divided into 60 seconds . A minute is written as 1' and a second is written as 1'' .
1o= 60' and 1'= 60''
One radian is defined as angle subtended by arc , whose length is equal to its radius. One radian is denoted by 1c.
Relation between degree and radian :
Since a circle subtends at the centre an angle whose radian measure is 2π its degree measure is 3600
ie., 2π radian = 3600 or
π radian = 1800
Using approximatevalue of π as 22/7 ,we have
1 radian = 180/π ≈ 57016'
10= π/180 radian ≈ 0.01746 radian
The Values of Sinθ, Cosθ and Tanθ
The graph of Sinθ
The graph of Sinθ , 0≤ θ ≤ 2∏
Steps for constructing the applet
1. Open a new Geogebra file
2.Mark the point A (0,0)
3. Draw a unit circle with centre at A
4. Mark the intersecting point B of circle with the X-axis.
5. Slider on number [ name : a, Interval; Min : -10, Max : 10, Incr : 0.1]
6. Use the tool Angle with given size , first click at B and then at A . At that time Angle with given size dialog box will appear. Replace the value 45 by "a" ( the slider name) and click O K. A new point D comes on the circle. Join D to A and draw a line through D which is perpendicular to X axis
7. Use the tool circular arc with centre between two points and click first at A and then at B and D , thus we obtain the arc.
8.Draw a line through D which is parallel to X axis.
9. Mark the point E (a,0) and draw a line through this point E which is perpendicular to X axis.
10. Mark the intersecting point F of the above two lines.
11. Right click on the point F and give tick mark on Trace on option.
12. Hide all the lines and give animation on to the slider a.
Monday, August 16, 2010
Vector Algebra
In our day to day life, we come across many queries such as - What is your height ? How should a football player hit the ball to give a pass to another player of his team? The possible answer to the first query may be 1.6m or 1.4m...- a quantity that involves only one value (magnitude) which is a real number. Such numbers are called scalars. However, an answer to the second query is a quantity (force) which involves muscular strength (magnitude) and direction (in which another player is positioned). Such quantities are called vectors. ie, A quantity that has magnitude as well direction is called a vector.
Continue
.
Subscribe to:
Posts (Atom)